OpenDriveMap + VISSIM Co-Simulation: Modeling Pedestrian-Vehicle Conflict Zones in Urban Intersections
Urban intersections are among the most complex environments in transportation engineering—where pedestrian flows, cyclist movements, and vehicular traffic converge under dynamic signal control. Traditional traffic simulation tools handle vehicles well, but accurately modeling pedestrian-vehicle conflict zones requires a tightly coupled approach. This article explores how combining OpenDriveMap's high-fidelity road network description with PTV VISSIM's microscopic simulation engine enables engineers to analyze and mitigate conflict risks at complex urban intersections.
Why Conflict Zone Modeling Matters
Pedestrian fatalities at intersections remain a persistent safety challenge. According to the FHWA, unsignalized and signalized intersections together account for roughly 40% of all traffic fatalities in the United States. Simulation-based conflict analysis allows engineers to identify dangerous geometry, evaluate signal timing changes, and test countermeasures—before any physical construction begins.
Standard macroscopic or mesoscopic models aggregate pedestrian behavior into flow rates, masking the individual interactions that cause conflicts. Microscopic simulation, by contrast, tracks each agent's position, speed, and decision-making at sub-second resolution, making it the appropriate tool for conflict zone analysis.
OpenDriveMap: Precision Road Network Description
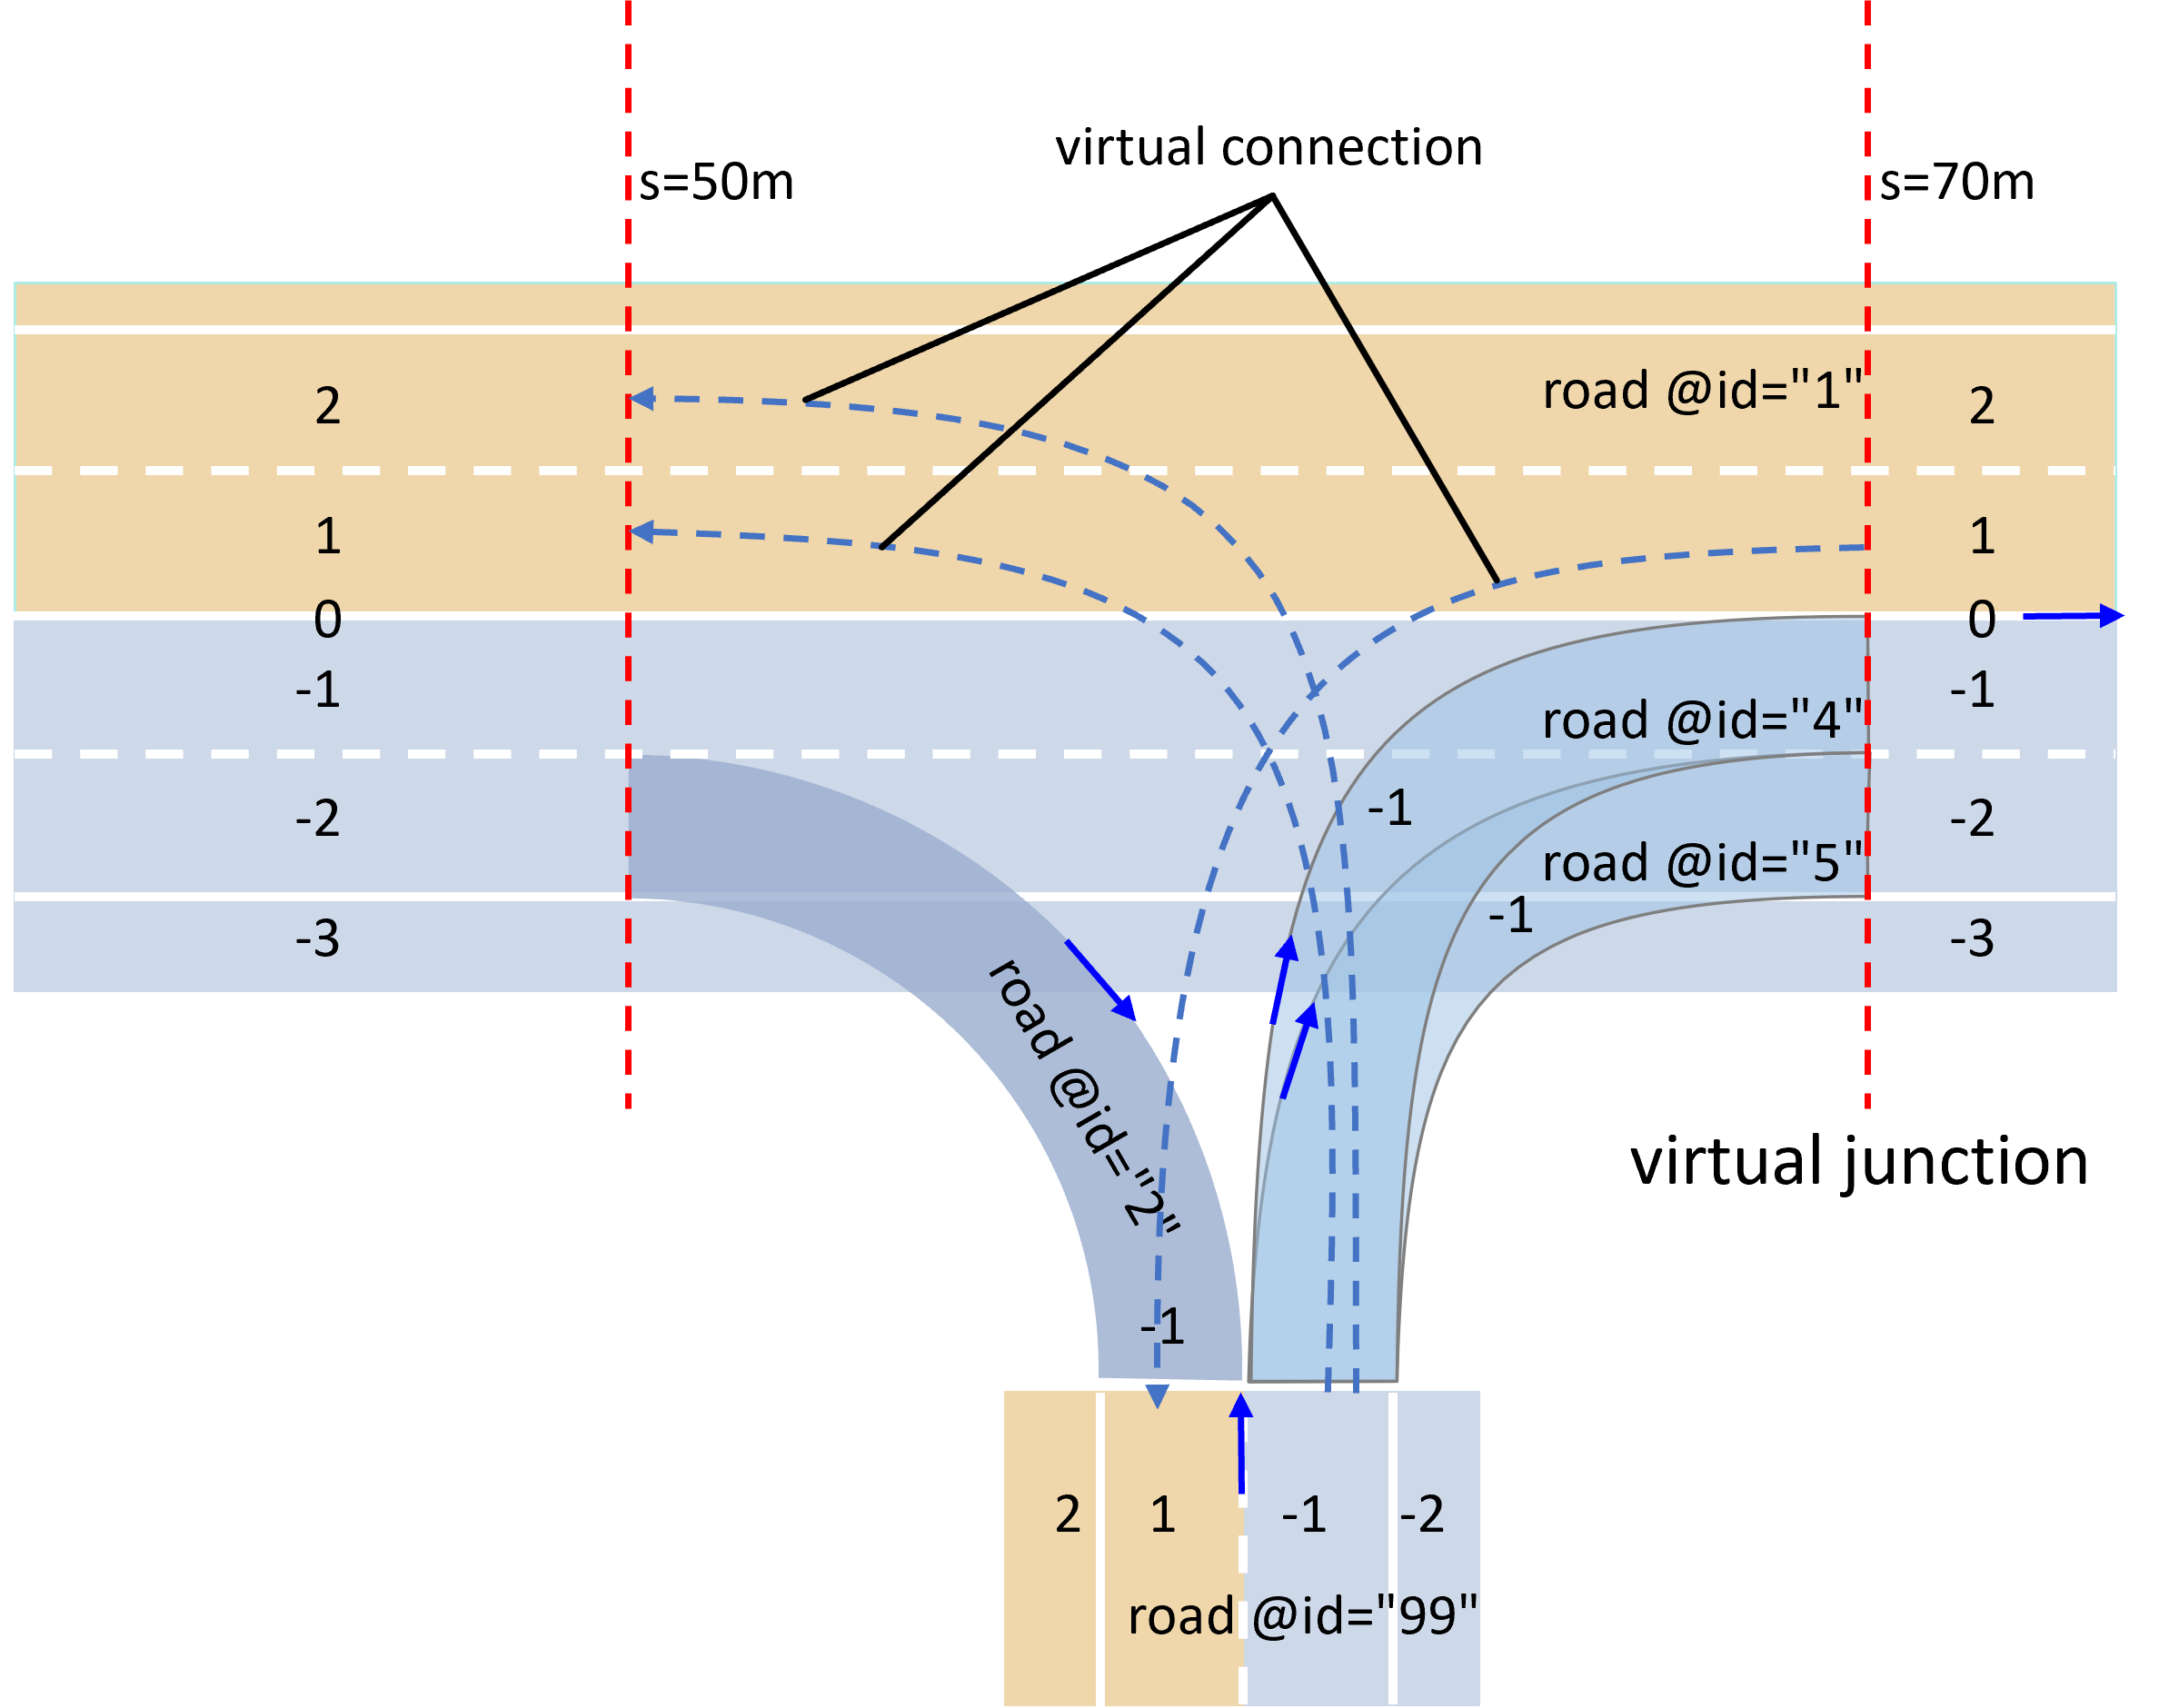
OpenDriveMap (built on the ASAM OpenDRIVE standard) provides a parametric, lane-level description of road geometry, including:
- Crosswalk geometry encoded as
<object>elements with precise lateral offsets - Pedestrian lanes defined as
laneType="sidewalk"orlaneType="biking"within road sections - Signal references linking traffic light positions to lane groups via
<signal>records - Junction connectivity expressed as explicit lane-link tables, enabling VISSIM to resolve turning movements without manual connector drawing
Exporting an OpenDRIVE .xodr file from tools such as RoadRunner or JOSM (with the opendriveexport plugin) and importing it into VISSIM 2024 via File → Import → OpenDRIVE preserves sub-centimeter geometry accuracy. This eliminates the manual digitizing step that historically introduced geometric errors into conflict zone models.
Configuring Pedestrian Behavior in VISSIM
VISSIM models pedestrians using its Pedestrian Simulation module (based on the Social Force Model). Key configuration steps for conflict zone analysis:
1. Define Pedestrian Areas and Routes
After importing the OpenDRIVE network, add pedestrian areas over crosswalk polygons using the Pedestrian Area tool. Assign pedestrian routes with origin-destination matrices derived from field counts or synthetic demand from a travel demand model.
2. Calibrate Social Force Parameters
The Social Force Model governs how pedestrians repel from obstacles and other agents. For urban intersection contexts, calibrate:
| Parameter | Typical Range | Conflict-Zone Recommendation |
|---|---|---|
| Desired Speed (m/s) | 1.0–1.6 | 1.2 (mixed urban population) |
| Repulsion Strength (A) | 1.0–3.0 | 2.5 (high-density crossings) |
| Repulsion Range (B) | 0.1–0.5 m | 0.25 m |
| Reaction Time | 0.3–0.8 s | 0.5 s |
Calibrate against observed pedestrian trajectories using video data processed with tools like TrafficIntelligence or OpenCV-based trackers.
3. Signal Control Integration
Link VISSIM's signal controllers to pedestrian crossing phases using Fixed-Time or VAP (Vehicle Actuated Programming) logic. For adaptive control, connect VISSIM to an external controller via the COM API or use the built-in VISSIG interface. Ensure pedestrian recall phases are correctly encoded so the simulation reflects real-world signal operation.
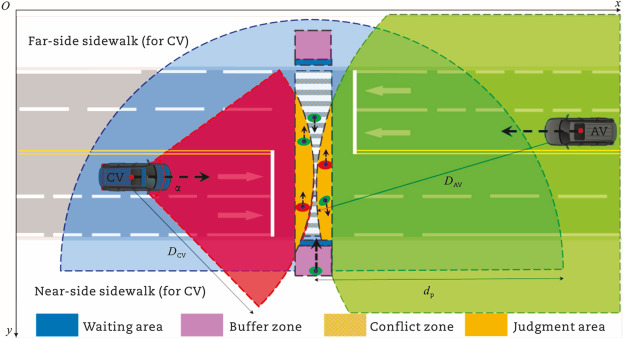
Extracting Conflict Metrics
VISSIM's Conflict Areas feature automatically detects geometric overlap zones between vehicle and pedestrian paths. For each conflict area, the simulation records:
- Post-Encroachment Time (PET): Time between a vehicle clearing a conflict zone and a pedestrian entering it. PET < 1.5 s is generally considered a serious conflict.
- Time-to-Collision (TTC): Estimated time until collision if both agents maintain current trajectories. TTC < 1.5 s indicates a critical event.
- Gap Acceptance: Distribution of accepted and rejected gaps by pedestrians, useful for evaluating crossing compliance under different signal timings.
Export conflict data via Evaluation → Conflict Areas → Export to CSV for post-processing in Python or R. A typical analysis workflow:
import pandas as pd
import matplotlib.pyplot as plt

df = pd.read_csv('conflict_areas.csv', sep=';')
serious = df[df['PET'] < 1.5]
print(f"Serious conflicts: {len(serious)} ({100*len(serious)/len(df):.1f}%)")

df['PET'].hist(bins=30, edgecolor='black')
plt.xlabel('Post-Encroachment Time (s)')
plt.ylabel('Frequency')
plt.title('PET Distribution – Main St / 5th Ave Intersection')
plt.axvline(1.5, color='red', linestyle='--', label='Serious Conflict Threshold')
plt.legend()
plt.tight_layout()
plt.savefig('pet_distribution.png', dpi=150)
Countermeasure Evaluation Workflow
Once a baseline conflict profile is established, engineers can systematically test countermeasures:
- Leading Pedestrian Intervals (LPI): Give pedestrians a 3–7 second head start before vehicles receive a green. Studies show LPI reduces pedestrian-vehicle conflicts by 60% at high-volume intersections.
- Pedestrian Refuge Islands: Model as additional pedestrian areas mid-crossing; evaluate whether two-stage crossings reduce TTC events.
- Curb Extensions (Bulb-Outs): Shorten crossing distance and improve sightlines; adjust OpenDRIVE geometry and re-import to VISSIM.
- Exclusive Pedestrian Phases (Barnes Dance): Evaluate throughput trade-offs against conflict reduction using VISSIM's delay and queue length outputs.
Each scenario requires only geometry or signal timing changes in the model—no new field data collection—making simulation an extremely cost-effective screening tool.
Validation and Limitations
Validate conflict predictions against field-observed PET data collected via video analysis. Expect model-to-field agreement within ±20% for serious conflict counts when pedestrian demand and signal timing are accurately represented.
Key limitations to communicate to stakeholders:
- The Social Force Model does not capture distracted pedestrian behavior (e.g., smartphone use), which can significantly alter gap acceptance.
- VISSIM's conflict detection is geometry-based; it does not account for driver evasive maneuvers that prevent actual collisions.
- Calibration data requirements are non-trivial; poorly calibrated models can underestimate conflict frequency by 30–50%.
Further Resources
- ASAM OpenDRIVE Standard – Official specification for road network description
- PTV VISSIM Documentation – Pedestrian simulation and conflict area configuration
- FHWA Pedestrian Safety Guide – Countermeasure effectiveness data
- SSAM (Surrogate Safety Assessment Model) – FHWA tool for conflict analysis from trajectory data
- TrafficIntelligence – Open-source video-based trajectory extraction
By combining OpenDRIVE's precise geometric description with VISSIM's microscopic agent modeling, transportation engineers gain a rigorous, reproducible framework for quantifying pedestrian-vehicle conflict risk and evaluating safety countermeasures before committing to costly infrastructure changes.