SAM (System Advisor Model): Performance Modeling and Financial Analysis for Renewable Energy Projects
The National Renewable Energy Laboratory's System Advisor Model (SAM) is the industry-standard tool for techno-economic analysis of renewable energy projects. Used by project developers, utilities, researchers, and policymakers worldwide, SAM combines detailed performance simulation with sophisticated financial modeling to answer the central question in any renewable energy project: What will this system actually cost and produce over its lifetime?
What SAM Does — and Why It Matters
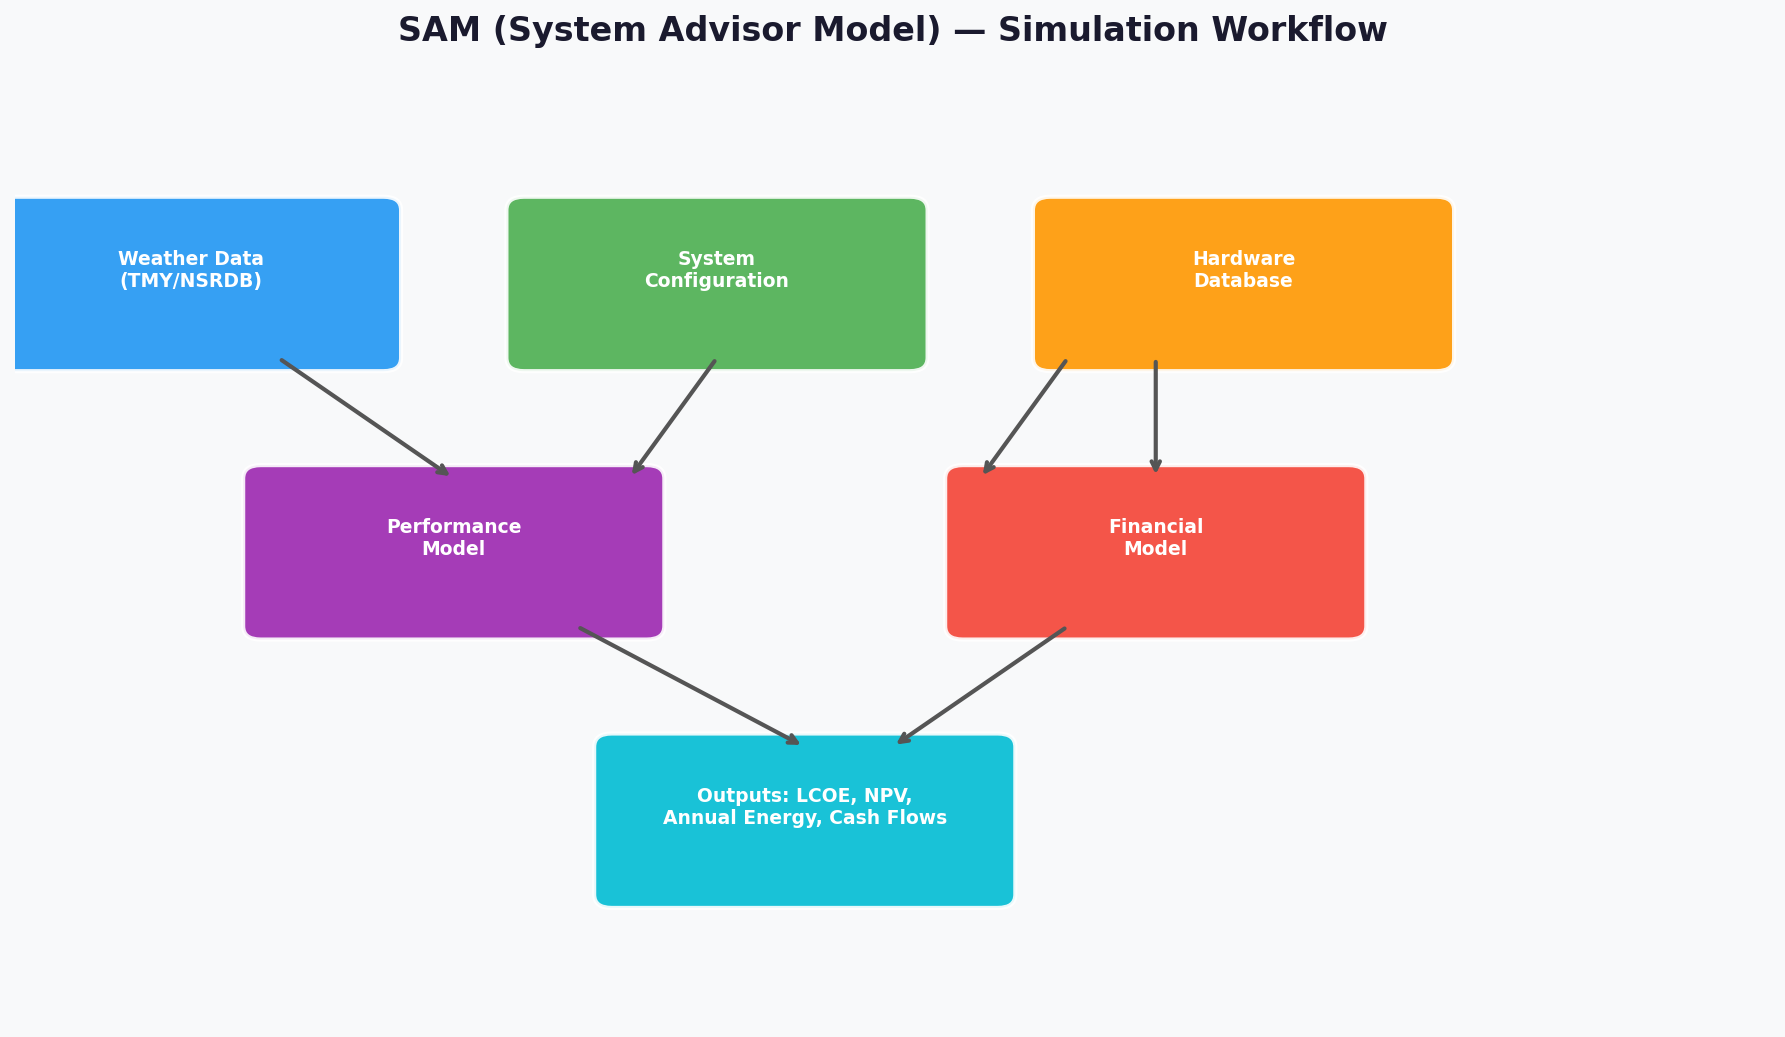
SAM integrates two tightly coupled simulation engines: a performance model that calculates hourly energy output based on weather data and system configuration, and a financial model that translates that output into levelized cost of energy (LCOE), net present value (NPV), payback period, and cash flow projections. This coupling is what distinguishes SAM from simpler tools — a change in panel tilt angle, inverter efficiency curve, or degradation rate propagates immediately through to the financial outputs.
SAM supports a broad range of technologies:
- Photovoltaics: Flat-plate PV (residential, commercial, utility-scale), concentrating PV
- Concentrating Solar Power (CSP): Parabolic trough, power tower, linear Fresnel, dish-Stirling
- Wind: Land-based and offshore wind farms
- Battery storage: Standalone and PV+storage systems
- Geothermal, biomass, and fuel cells
Performance Modeling in Depth
PV System Modeling
SAM's PV performance engine is built on the CEC (California Energy Commission) module model and the Sandia Array Performance Model, both of which capture the nonlinear relationship between irradiance, cell temperature, and output power. Key inputs include:
- Weather files: SAM ships with TMY3 (Typical Meteorological Year) and TMY2 datasets for thousands of U.S. locations, and accepts EPW files for international sites. The NSRDB (National Solar Radiation Database) integration allows direct download of satellite-derived irradiance data.
- Module and inverter databases: SAM includes the CEC module database (>20,000 modules) and the CEC inverter database, enabling engineers to model specific commercial hardware rather than generic assumptions.
- Shading and soiling: The 3D shading calculator handles near-field obstructions, while soiling loss factors can be applied monthly or as a time series.
- DC/AC ratio and clipping: SAM explicitly models inverter clipping losses, which are critical for accurately sizing high-DC/AC ratio systems common in utility-scale projects.
CSP Modeling: The SAM Parabolic Trough Model
For CSP, SAM's parabolic trough model (based on the Excelerate/SolarPACES methodology) simulates the entire solar field, heat transfer fluid loop, thermal energy storage (TES) tank, and power block on an hourly basis. Engineers can evaluate the trade-off between solar multiple and TES hours — a key design decision that determines whether a plant can provide dispatchable power into evening peak periods.
Financial Modeling
SAM's financial models cover the full spectrum of project structures:
| Model | Typical Use Case |
|---|---|
| Residential | Rooftop PV with net metering |
| Commercial (PPA) | C&I behind-the-meter with power purchase agreement |
| Single Owner | Utility-scale project with tax equity |
| Partnership Flip | MACRS depreciation + ITC with tax equity investor |
| Sale Leaseback | Alternative tax equity structure |
| Merchant Plant | Merchant revenue with hourly price signals |
The Partnership Flip model is particularly important for U.S. utility-scale solar and wind, as it correctly handles the ITC (Investment Tax Credit) or PTC (Production Tax Credit) allocation between the tax equity investor and the project sponsor across the flip horizon.
Key Financial Outputs
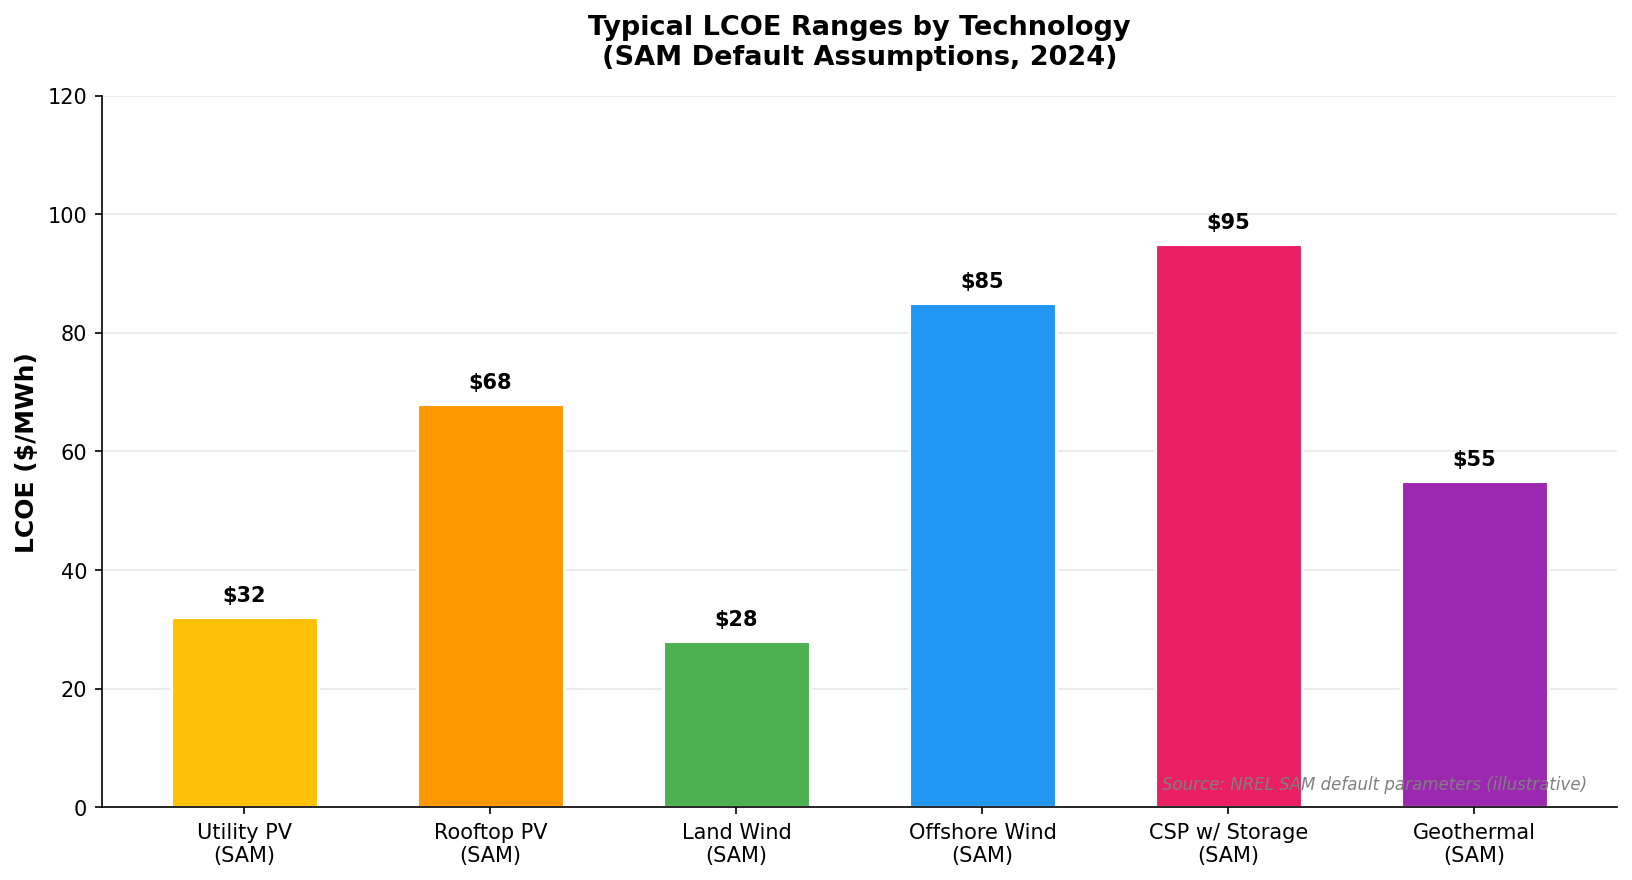
- LCOE (real and nominal): The levelized cost of energy, expressed in $/kWh, is SAM's headline metric. It accounts for all capital costs, O&M, financing costs, and degradation over the project life.
- NPV and IRR: For investor-facing analysis, SAM reports after-tax NPV and IRR from the project sponsor's perspective.
- Annual cash flows: A full 25–30 year cash flow table showing revenue, expenses, debt service, tax benefits, and distributions.
Parametric Analysis and Optimization
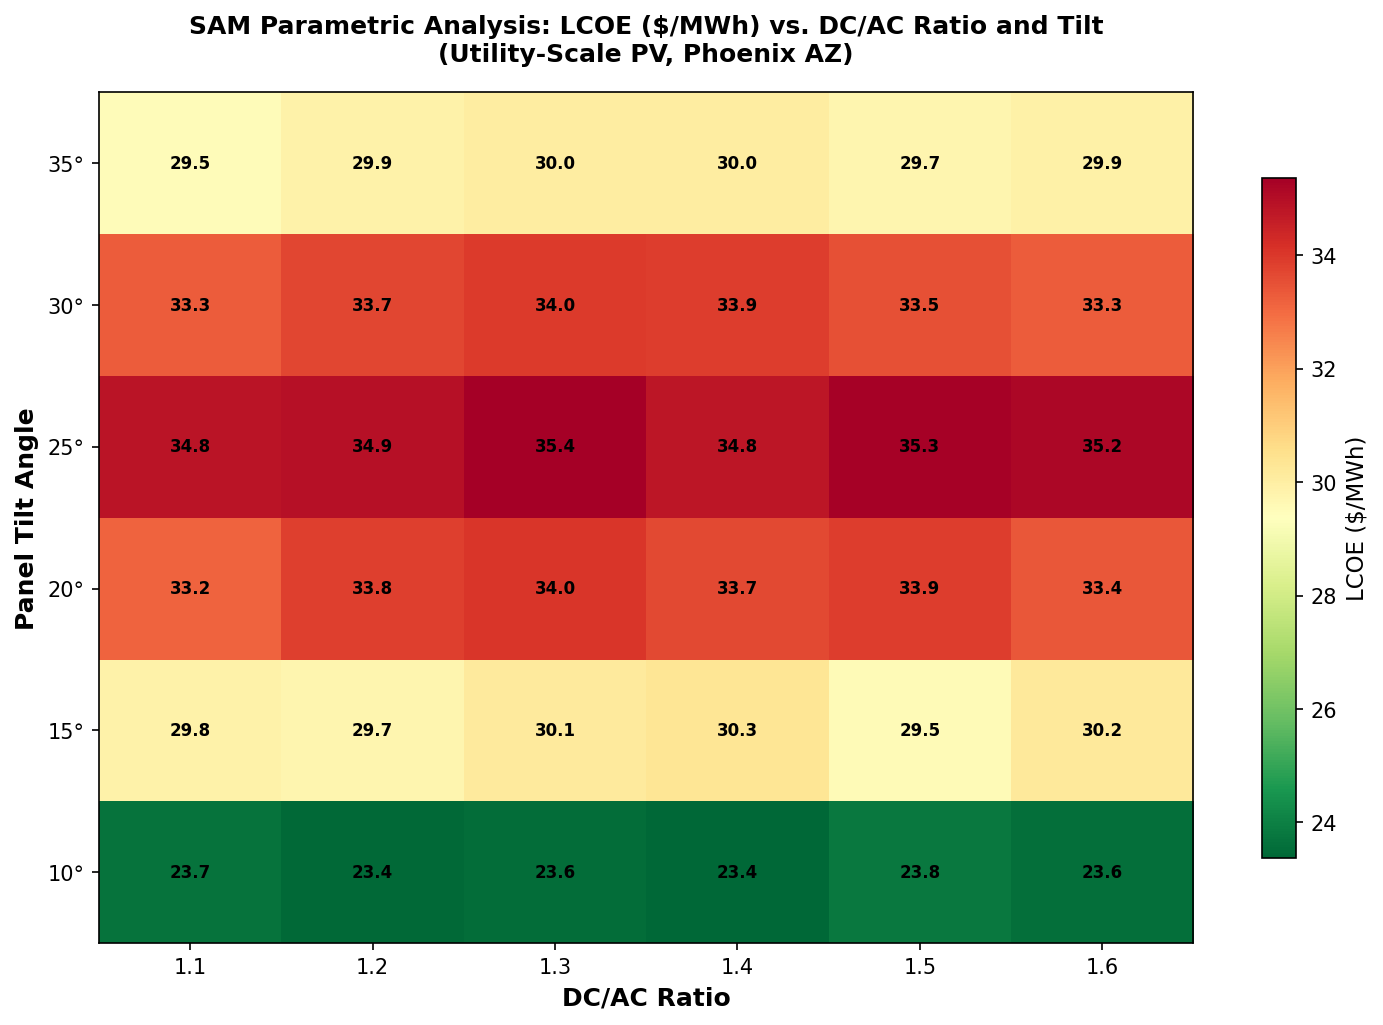
One of SAM's most powerful features is its parametric analysis capability. Engineers can sweep any input parameter — DC/AC ratio, tilt angle, storage capacity, PPA price — across a defined range and plot the resulting LCOE or NPV surface. This is invaluable for:
- Sensitivity analysis: Identifying which inputs most strongly affect project economics
- Design optimization: Finding the system configuration that minimizes LCOE
- Scenario comparison: Evaluating the impact of different incentive structures or financing assumptions
The stochastic analysis module extends this to Monte Carlo simulation, allowing engineers to quantify the probability distribution of financial outcomes given uncertainty in key inputs such as resource variability, equipment costs, and electricity prices.
Scripting with the SAM SDK and Python
SAM exposes its simulation engine through the SAM Software Development Kit (SDK), which provides language bindings for Python, C/C++, MATLAB, and others. The Python interface (PySAM) is the most widely used:
import PySAM.Pvwattsv8 as pv
import PySAM.Utilityrate5 as ur
import PySAM.Cashloan as cl

# Load a SAM case file
system = pv.default("PVWattsResidential")
system.SystemDesign.system_capacity = 10  # kW
system.execute()
annual_energy = system.Outputs.annual_energy
print(f"Annual energy: {annual_energy:.0f} kWh")
PySAM enables automated batch analysis — for example, running SAM for thousands of locations to build a national LCOE map, or integrating SAM into a larger optimization loop.
Practical Workflow for a Utility-Scale PV Project
- Download weather data: Use the NSRDB API integration to pull TMY or single-year data for the project site.
- Select hardware: Choose modules and inverters from the CEC database matching the project's equipment schedule.
- Configure the system: Set DC/AC ratio, tilt, azimuth, row spacing, and ground coverage ratio.
- Run the performance model: Review the loss diagram to identify the largest loss contributors (soiling, mismatch, wiring, clipping).
- Set up the financial model: Enter EPC cost, O&M cost, financing terms, and applicable incentives (ITC, state rebates).
- Run parametric sweeps: Optimize DC/AC ratio and tilt for minimum LCOE.
- Export results: SAM generates Excel-compatible output tables and charts for inclusion in project reports.
Limitations and Complementary Tools
SAM is a system-level tool — it does not perform electrical design (string sizing, cable sizing, protection coordination) or detailed shading analysis for complex rooftop geometries. For those tasks, engineers typically use PVsyst (detailed PV design), Helioscope (rooftop layout), or AutoCAD-based tools. SAM's financial models also do not replace a full project finance model for lender due diligence; they are best used for pre-feasibility and comparative analysis.
For grid integration studies — understanding how a SAM-modeled plant interacts with the transmission system — outputs can be fed into PLEXOS, MATPOWER, or pandapower for production cost or power flow analysis.
Further Resources
- SAM Official Website (NREL) — Download, documentation, and case studies
- PySAM Documentation — Python API reference
- SAM GitHub Repository — Source code and issue tracker
- NSRDB Data Viewer — Solar resource data for SAM inputs
- SAM User Forum — Community support and example files