
Supply Chain Network Design with anyLogistix: Optimizing Facility Location and Flow Allocation
Supply chain network design is one of the most strategically consequential decisions a manufacturing organization can make. Choosing where to locate distribution centers, how to allocate product flows between facilities, and how to balance service-level commitments against logistics costs can determine competitive advantage for years. anyLogistix (ALX), developed by AnyLogic Company, is a purpose-built supply chain analytics platform that combines deterministic network optimization with stochastic simulation — giving engineers and analysts the ability to both design optimal networks and stress-test them against real-world variability.
anyLogistix network design interface: facility locations, transportation lanes, and cost optimization results
What Makes anyLogistix Different
Most supply chain design tools rely exclusively on linear programming (LP) or mixed-integer programming (MIP) to find cost-optimal facility configurations. While powerful, these approaches assume deterministic demand and fixed lead times — conditions that rarely hold in practice. anyLogistix bridges this gap by offering two tightly integrated analysis modes:
- Network Optimization (NO): A MIP-based solver that determines optimal facility locations, capacity assignments, and product flow allocations across a multi-echelon network. Users define potential facility sites, transportation lanes, demand points, and cost structures; the solver returns the minimum-cost (or maximum-service-level) configuration.
- Greenfield Analysis (GFA): A gravity-model heuristic that identifies candidate facility locations from scratch based on demand geography and transportation cost surfaces — useful when the candidate site list is not yet known.
- Simulation (SIM): A discrete-event and agent-based simulation engine that replays the optimized network under stochastic demand, variable lead times, and disruption scenarios to validate robustness before capital is committed.
This NO → SIM workflow is anyLogistix's defining capability. An optimized network that looks excellent on paper may perform poorly when demand spikes 30% in one region or a key supplier experiences a two-week delay. The simulation layer surfaces these vulnerabilities quantitatively.
Setting Up a Multi-Echelon Network Optimization
A typical anyLogistix NO study involves the following configuration steps:
1. Define the Network Topology
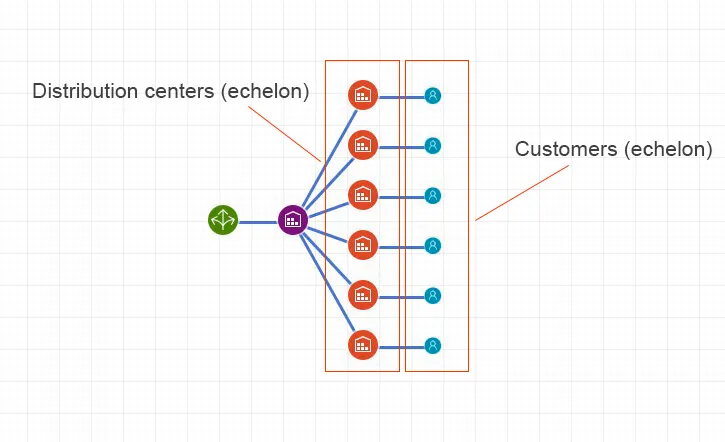
Users specify sites (factories, distribution centers, cross-docks, customer zones) and transportation lanes connecting them. Each lane carries a cost-per-unit-distance or a rate table. Sites are assigned to echelon levels — for example, a two-echelon network might have regional DCs sourcing from a central plant and serving retail demand zones.
2. Load Demand Data
Demand is imported as historical or forecast data at the customer-zone level, typically from CSV or Excel. anyLogistix supports multiple product families (SKUs) and time periods, enabling seasonal demand patterns to be captured in the optimization objective.
3. Configure Facility Cost Structures
Each candidate facility carries:
- Fixed opening cost (annualized capital or lease cost)
- Variable handling cost per unit throughput
- Capacity constraints (throughput, storage volume, or headcount)
The solver balances fixed facility costs against transportation savings from proximity to demand — the classic facility location trade-off.
4. Run the MIP Solver
anyLogistix uses the embedded CPLEX or Gurobi solver (license-dependent) to solve the facility location and flow allocation problem. For large networks (hundreds of sites, thousands of lanes), users can apply scenario decomposition or set a MIP gap tolerance to obtain near-optimal solutions within acceptable runtimes.
The output includes: which facilities to open, the flow volume on each lane, total cost breakdown by facility and transportation, and service-level metrics (e.g., percentage of demand served within target lead time).
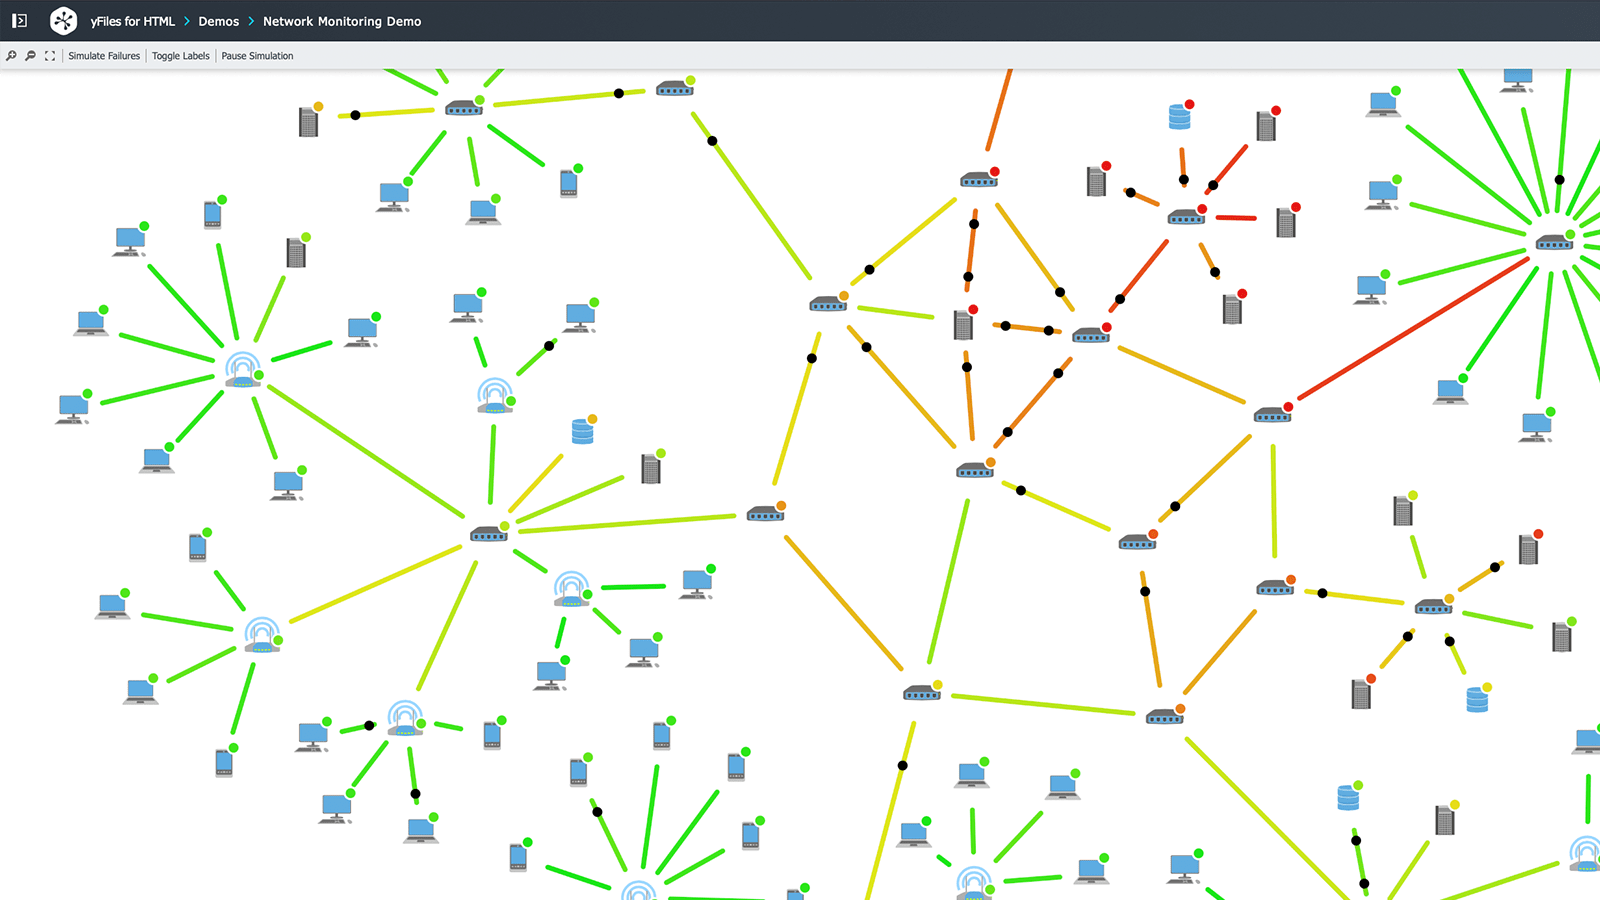
Multi-echelon supply chain network visualization: nodes represent facilities, edges represent transportation lanes with flow volumes
Transitioning to Simulation for Robustness Validation
Once the optimal network is identified, analysts transfer the configuration directly into the SIM module. Key stochastic inputs include:
- Demand distributions: Replace point forecasts with fitted statistical distributions (normal, log-normal, empirical) at each customer zone.
- Lead time variability: Specify mean and coefficient of variation for each transportation lane and supplier.
- Inventory policies: Define reorder points, order quantities, and safety stock levels at each DC. anyLogistix supports (s, S), (r, Q), and periodic review policies natively.
- Disruption scenarios: Model supplier outages, port closures, or demand shocks as probabilistic events with defined duration distributions.
Running the simulation for 50–200 replications (each representing one year of operations) produces confidence intervals on KPIs such as fill rate, average inventory investment, total landed cost, and stockout frequency. This output directly informs safety stock sizing and contingency sourcing decisions.
Multi-echelon inventory cost analysis in anyLogistix: comparing single-echelon vs. coordinated multi-echelon policies
Practical Best Practices
Calibrate transportation costs carefully. The NO solution is highly sensitive to lane cost assumptions. Use actual carrier rate cards or TMS data rather than generic per-mile estimates. Misspecified costs can shift optimal DC locations by hundreds of miles.
Use GFA before NO for greenfield projects. When the candidate site list is open-ended, run a Greenfield Analysis first to identify 3–5 high-potential regions, then restrict the NO candidate set to sites within those regions. This dramatically reduces solver runtime without sacrificing solution quality.
Validate inventory policies in simulation before finalizing. The NO module does not model inventory dynamics — it assumes instantaneous replenishment. Always run at least 100 simulation replications to confirm that the chosen inventory policy achieves target fill rates under demand variability.
Leverage the Experiment framework for sensitivity analysis. anyLogistix's built-in experiment runner allows systematic variation of key parameters (demand growth rate, fuel cost, facility fixed costs) across scenarios, producing tornado charts that identify which assumptions most influence the optimal network design.
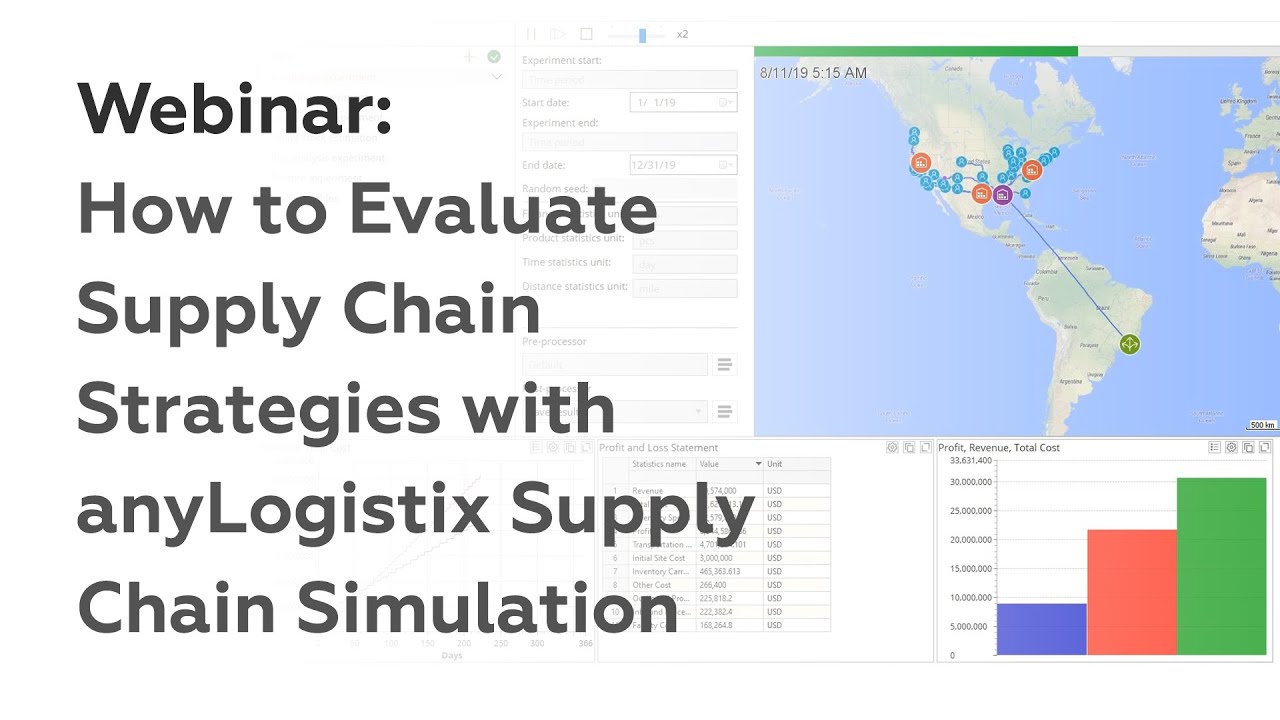
anyLogistix simulation module: stochastic demand modeling and KPI dashboards for network robustness validation
Integration with AnyLogic Models
For organizations already using AnyLogic for plant-level simulation, anyLogistix offers a complementary scope: where AnyLogic models the internal logistics of a single facility in high fidelity, anyLogistix models the inter-facility network at a strategic level. The two tools share a common data model and can exchange facility throughput constraints, enabling a nested modeling approach where AnyLogic-derived capacity curves feed directly into anyLogistix network constraints.
Conclusion
anyLogistix provides manufacturing and supply chain engineers with a rigorous, integrated workflow for strategic network design — moving from data-driven optimization to simulation-validated robustness in a single platform. By combining MIP-based facility location with stochastic discrete-event simulation, it closes the gap between theoretical optimality and operational reality. For organizations facing network redesign decisions driven by nearshoring trends, e-commerce growth, or supply chain resilience mandates, anyLogistix offers a structured, quantitative foundation for high-stakes infrastructure investment.
Further Reading: